In Praise of Pic (and pikchr)
In praise of what? Pic? Pic? Pic, the old diagram generation “little language” and half brother of roff (or troff or groff), from the days when Unix was young? Yes, indeed, that pic.
Why, in this day of convenient WYSIWYG tools, from Inkscape to Visio, would anybody want to make drawings using a command-language, which needs to be compiled to generate a viewable diagram? Well, as it turns out, there are in fact a number of excellent reasons:
-
Simple diagrams, in particularly block diagrams, can be created very simply, with just a few commands, thus providing an extraordinary convenient way to illustrate technical manuals.
-
Depending on the environment, pic commands may be embedded directly within the document that they are supposed to illustrate. This was already the case for the original pic, which was conceived as a pre-processor for troff documents with embedded pic commands. The idea lives on with pic’s current reincarnation and re-imagining as pikchr, which allows commands inside of fenced code blocks in Markdown documents.
-
Pic, specifically as re-imagined by pikchr, constitutes an interesting “frontend” to SVG. Pic’s graphics elements (such as boxes and circles) map pretty directly to SVG, thus making it possible to author SVG diagrams manually, but without having to edit the SVG code itself.
-
Pic is scriptable, making it an ideal tool when one has to draw several diagrams with minor, but precisely known differences.
-
Pic can use absolute or relative coordinates, which is very convenient when drawing geometric bodies or similar diagrams.
-
Pic outputs vector graphics (originally PostScript, pikchr creates SVG), which allow smooth scaling of diagrams to any desired size.
-
Pic is simple. The entire original manual, including plenty of examples, fits into some two dozen pages. No need to spend time on a complicated toolset, when one only wants to generate some illustrations.
-
And finally, pic is free, open-source, quite mature, and very well documented.
My own reasons for learning about pic were a combination of several of the above. I wanted to generate images of several three-dimensional bodies (cubes, cones, etc.). But I wanted to be free to change the viewing angles and orientations, without having to do a lot of manual rework. And finally, preparing these illustrations was supposed to distract me only minimally from my main objective. So, pic served me well. (In the meantime, I have illustrated an entire book with it.)
But there is yet another reason for studying pic. It is an interesting example of a domain-specific, “little” language. In particular, I was impressed how pic achieves great ease of use through meaningful defaults, which often seem to anticipate the “common case” very well. It can do so, in part because its application area is intentionally quite limited: black-and-white drawings of regular shapes. Because the job it is meant to do is small, pic itself can be simple.
Introducing pic
Pic is a little language for the specification of certain kinds of diagrams “frequently used in technical papers and textbooks” (quoted from “Making Pictures with GNU PIC” by Eric S. Raymond). It is not meant to be a general-purpose graphing language, although its scripting abilities allow application to areas not initially intended.
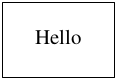
Here is the equivalent of “Hello, World!”, using pic:
.PS
box "Hello"
.PE
and it is compiled into PostScript using the following command-line (using the GNU version of all tools):
pic hello.pic | groff > hello.ps
Alternatively, you can call groff with the -p option, like so:
groff -p hello.pic > hello.ps
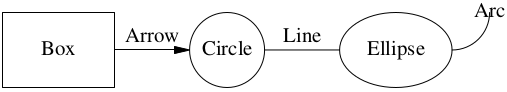
A more interesting program is this:
.PS
box "Box"
arrow "Arrow" ""
circle "Circle"
line "Line" ""
ellipse "Ellipse"
arc
"Arc"
.PE
With the exception of the spline command, this picture demonstrates
all graphing elements native to pic. We see two things: the syntax is
simple. (The only non-entirely-obvious feature are the lines
.PS and .PE. These are groff directives to start and end a
picture.) On the other hand, the selection of graphics primitives is
quite limited: no triangles, no diamonds, no pie slices, etc.
What struck me most about this syntax, though, was the kind of sensible
defaults. The diagram “flows” in some direction, following the commands.
New picture elements are joined to one another in an obvious way. (By
default, the flow is left-to-right, but can be changed at any point with
the up, down, left, and right directives.)
Decorations
Although the choice of graphics primitives is limited, there are many ways to change the appearance of the elements.
All elements can be individually sized like so:
.PS
box                 # Default size: 0.75 wide by 0.5 high
move
box width 0.1       # Full name of size attribute
move
box wid 1.5 ht 0.25 # Abbreviated attribute names are possible
.PE

All sizes are given in inches of the final (printed) diagram (!). The
overall scale can be changed by including the scale statement before
any drawing command, e.g. scale=2.54 will change the unit to
centimeters.
Objects can be dashed, dotted, and filled. GNU pic also allows to generate boxes with rounded corners. All these decorations can be customized, usually through a numeric argument. (In the example below, note the double arrow as well.)
.PS
box rad 0.15        # Box with rounded corners
line dotted
ellipse dashed 0.075
line <->            # Double arrow
circle fill 0.4

move to last circle .n + ( 1, 0 )  # Explained in section on Coordinates below
spline right 1 then down 0.5 left 1 then right 1

move to last spline .start         # Go back to start of spline, cf. text below
line dashed right 1 then down 0.5 left 1 then right 1
.PE
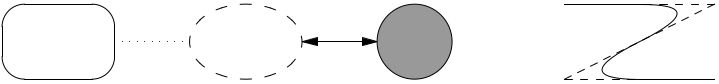
Splines can be used to express some “dynamic” diagrams in an easy fashion. They are specified through their vertices as seen when comparing the spline to the control line in the picture above.
Coordinates
Pic makes massive use of relative coordinates. Mostly, you tell pic to go some place by telling it how to get there from some place you already know. To this end, pic gives you a rather expressive set of commands to describe relative positions.
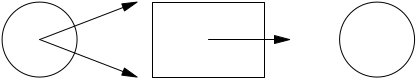
The simplest is the last (or 2nd last etc.) directive:
.PS
circle
move
box
move
circle

arrow from 2nd last circle to last box .nw
arrow from 2nd last circle to last box .sw

line from last box to last circle .w
.PE
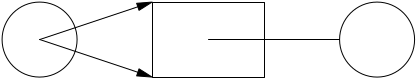
If nothing else is specified, a position is located at the center of a
picture element. However, we can also express different points on a
picture element, by using “compass points”, such as .n (north), .ne
(north-east), .e (east), etc. For lines, arrows, and splines, we can
use the .start, .center, and .end control points. (The dot
preceding each location name can be remembered by thinking of graphics
elements as structs and the control points as their members.)
To specify arbitrary locations using these control points, we can either
use offsets, using the notation of vector addition, e.g. last box.ne + ( 0.1, 0.1 ). Alternatively, we can “interpolate” between any two
positions by specifying a fraction, using the rather verbose syntax f of the way between p1 and p2 or the much terser variation f<p1, p2>.
.PS
C1: circle
move
B:  box
move
C2: circle

arrow from C1 to B .nw + ( -0.1, 0 )         # Vector addition
arrow from C1 to B .sw + ( -0.1, 0 )

arrow from B to 1/3 between B .e and C2 .w   # Interpolation
.PE
In the last example, we have used labels (starting with a capital letter and ending with a colon) to refer to picture elements. Labels are a great help to stay in control of more complex diagrams. Use them a lot!
While relative coordinates are very convenient, and allow easy, almost LOGO-like creation of diagrams, absolute coordinates can have their advantages, too. In particular, I found it helpful to define a set of “reference points” at the beginning of a complex diagram and to assign labels to them. Relative coordinates and offsets can then be made from those reference points.
.PS
A: (    0, sqrt(3/4))
B: (  0.5, 0)
C: ( -0.5, 0)

line from A to B then to C then to A
circle rad 0.1 at A
circle rad 0.1 at B
circle rad 0.1 at C
.PE
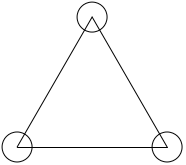
Note the use of the mathematical expression sqrt(3/4) in the last
example. Pic allows you to include mathematical expressions (including
trigonometric functions, exponentials and logarithms) and to evaluate
them at runtime.
Macros, Scripting, Shell Escapes
You can define “macros” in pic, using the define command. Through
macros, we can extend the very small set of built-in graphics
primitives. The following program demonstrates a friendly example.
.PS
define smiley {
   # Takes three arguments: $1: x-pos, $2: y-pos, $3: size (radius)

   r0 = $3       # Face
   r1 = 0.4*r0   # Radius of mouth and eye locations
   r2 = 0.04*r0  # Radius of eyes

C: circle rad r0 at ( $1, $2 )

   circle rad r2 filled at last circle + ( r1, r1 )      # Right eye
   circle rad r2 filled at 2nd last circle + ( -r1, r1 ) # Left eye

   pi = atan2( 0, -1 )
S: C + ( r1*cos(1.25*pi), r1*sin(1.25*pi) )
   line from S to S
   for phi=1.25*pi to 1.75*pi by 0.1 do {
     line to C + ( r1*cos(phi), r1*sin(phi) )            # Mouth
   }
}

pi2 = 2*atan2( 0, -1 )
for x=0.1 to 1.3 by 0.08 do {
  smiley( 1.5*x*cos(x*pi2), 1.1*x*sin(x*pi2), 0.23*x )
}
.PE
Note how “variables” can be passed to the macro and are available inside
the macro in the form of the expressions $1, $2, etc.
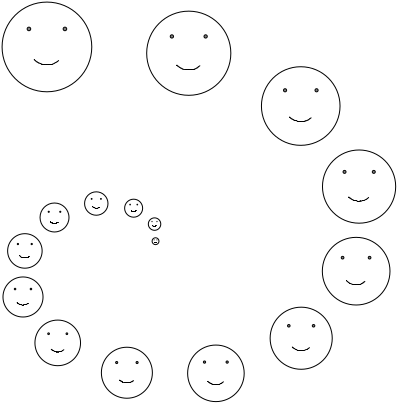
The last example also demonstrated pic’s built-in looping facility. (There is a conditional construct, as well.)
Macros, together with the control flow constructs, can be used to generate graphics elements which are missing from the list of built-in primitives. For instance, the mouth of the Smiley in the example above shows how arbitrary arcs (i.e. with arbitrary start and end angles) can be set up as macros.
Finally, pic can execute an arbitrary command or include an arbitrary
file through the sh or copy commands, respectively. This can be very
handy. For instance, in the example below the Perl program trsf.pl
applies a set of coordinate transformations to the raw coordinates
contained in the file coords.raw and generates an intermediate file
coords.tmp of pic objects (e.g. containing lines like A: ( 0.2, 0.5 ), etc.). This intermediate file is included though the copy command,
and the locations defined in it are then used to generate the actual
drawing.
.PS
sh { perl trsf.pl < coords.raw > coords.tmp }
copy "coords.tmp"

spline from A then to B then to C then to D then to E
circle at F
.PE
This can be more convenient than reading commands from standard input, because in the example above, the Perl program does not actually have to generate complete pic commands: it merely transforms and formats raw coordinates, the remainder of the drawing commands is kept in a separate pic program file.
(Note that escaping to a sub-shell is considered “unsafe”, since in
principle any command could be executed by sh{...} and pic needs to
be put into “unsafe” mode using the -U command-line option.)
After Pic
No program is an island, and pic is no exception. We have already seen how to include output of other programs into pic. What can we do with the output generated by pic?
Traditional pic is merely a pre-processor for troff, so we can include troff commands in a pic program. In general, lines beginning with a period are being passed through to troff. This is mostly useful to control the rendering of text included in a pic-diagram. Some of the most relevant troff commands are:
.ft XChanges the font shape, whereXcan be one of:R(upright, “Roman”),B(bold),I(italic),BI(bold-italic), orP(previous - to switch back to the previous font)..ps NChanges the font size. The argumentNcan either be a number, giving the absolute size of the desired font in printer points (e.g..ps 14), or it can be a relative size specification (such as.ps +2or.ps -2), which changes the font size relative to the previous size. Omitting the argument will reset the font size to the previous value..fam FChanges the font family, e.g. the argumentTselects Times Roman,Hselects Helvetica, etc.
By default, troff generates plain PostScript, although it can also
generate output suitable for processing by TeX, as well as some other
formats. When creating standalone graphs (as opposed to entire documents
with embedded graphics), it is usually a good idea to pipe pic’s output
through ps2eps. This program converts plain PostScript into encapsulated
PostScript, and crops the page to the minimal “bounding box” containing
the image.
The resulting EPS file can now be processed further. It may be useful
to convert it to PDF, for example using epstopdf, and on to a raster
format, for example with pdftocairo.
Pic Reloaded: pikchr (added, 2022)
D. Richard Hipp, the author of SQLite, has implemented pikchr, a
modern tool that is based on pic. In contrast to traditional pic,
pikchr creates SVG.
Most of pic’s commands carry over to pikchr. There are a few
additional shapes (oval, database, and file), better support for
color, and some other improvements. At the same time, pikchr
drops supports for loops and conditionals. The
differences
are clearly documented.
The idea is that pikchr commands can be embedded in a Markdown
document. When this document is converted to HTML, the embedded
commands can be replaced with embedded SVG, thus creating an
illustrated documented.
But pikchr is also extremely useful as a standalone tool for
creating SVG documents. In contrast to WYSIWYG tools, pikchr
gives the user greater control over the structure of the
resulting SVG, which may be desirable if the document is to
be modified using, for instance, d3.js.
Summary
This concludes our brief overview over pic. Despite its age, it is still amazingly useful when generating certain diagrams, in particular when the diagrams are to be scripted in some way.
Pic is a small language and easy to pick up. Although this post is not comprehensive, it introduces almost all of the elements of the pic language. The sensible choice of defaults, and the rich facilities to express relative coordinates make working with pic quite easy and rather enjoyable.
Resources
- The original tutorial and reference on pic was authored by Brian Kernighan: “PIC - A Graphics Language for Typesetting” and provides a complete introduction in a mere 25 pages.
- Eric S. Raymond has written an updated manual, specifically for the GNU version of pic (and groff) “Making Pictures with GNU PIC”, which, at 37 pages, is not much longer.
Between those two papers, you will find answers to almost all questions about pic. Both can be found on the Web, for example on the pikchr website (look for the section “Copies of Historical PIC Documentation”).
I should also mention dpic (Gitlab), which is yet another tool based on the original pic. Whereas the traditional pic was intended as a preprocessor to troff, dpic is mostly intended to be used in conjunction with LaTeX, but it can also produce PDF and SVG.
A version of this guide originally appeared on the O’Reilly Network in 2007. It has been been lightly revised and updated to include references to pikchr and dpic.